Enrollment, voters and demographics
Texas Public School Enrollment Trends and Insights
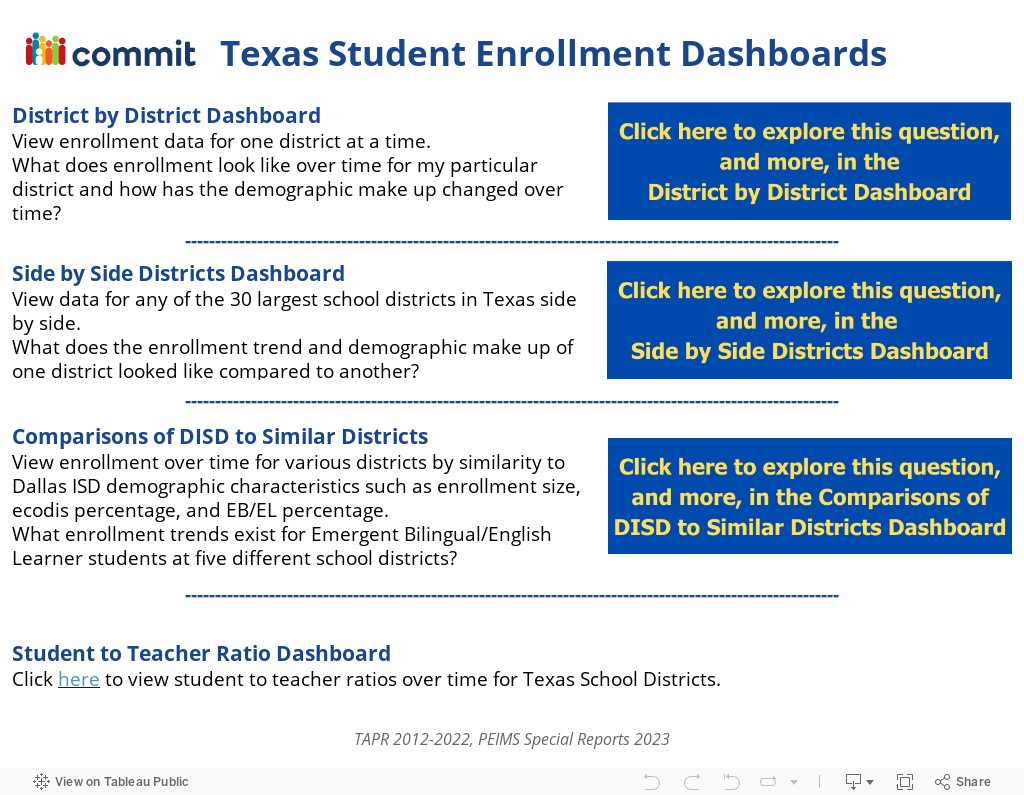
- Are there any major changes in student enrollment trends in my district?
- What is the demographic make up of the student body in neighboring districts?
- Which districts statewide have similar student populations?
This dashboard provides education data on student enrollment and demographics year-over-year across districts in Texas. Track and compare changes in the percentage of students experiencing economic disadvantage, emergent bilingual populations, racial/ethnic groups, and more.

.jpg)
share

Still have data questions?
If you can’t find the data you need, are having trouble, want to offer feedback or find our how our numbers are calculated, we’re here for you.
Be a part of the impact
Invest


.avif)