Campus and district accountability
Visualize TEA Accountability Ratings Across Texas Schools
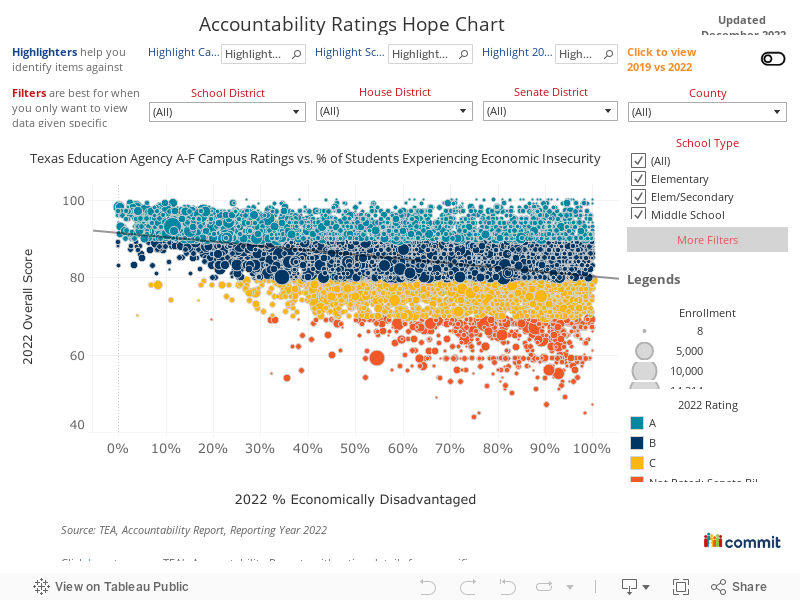
- How do percentages of students experiencing economic disadvantage correlate with average accountability ratings?
- Where can I track accountability ratings over time across different districts?
- What Texas Education Agency A-F Campus Rating was my child’s or student’s school given?
A "hope chart" demonstrates what's already possibly within our public education system by highlighting campuses and districts that are exceeding expectations in key academic benchmarks.

.jpg)
share

Still have data questions?
If you can’t find the data you need, are having trouble, want to offer feedback or find our how our numbers are calculated, we’re here for you.
Be a part of the impact
Invest


.avif)