STAAR performance
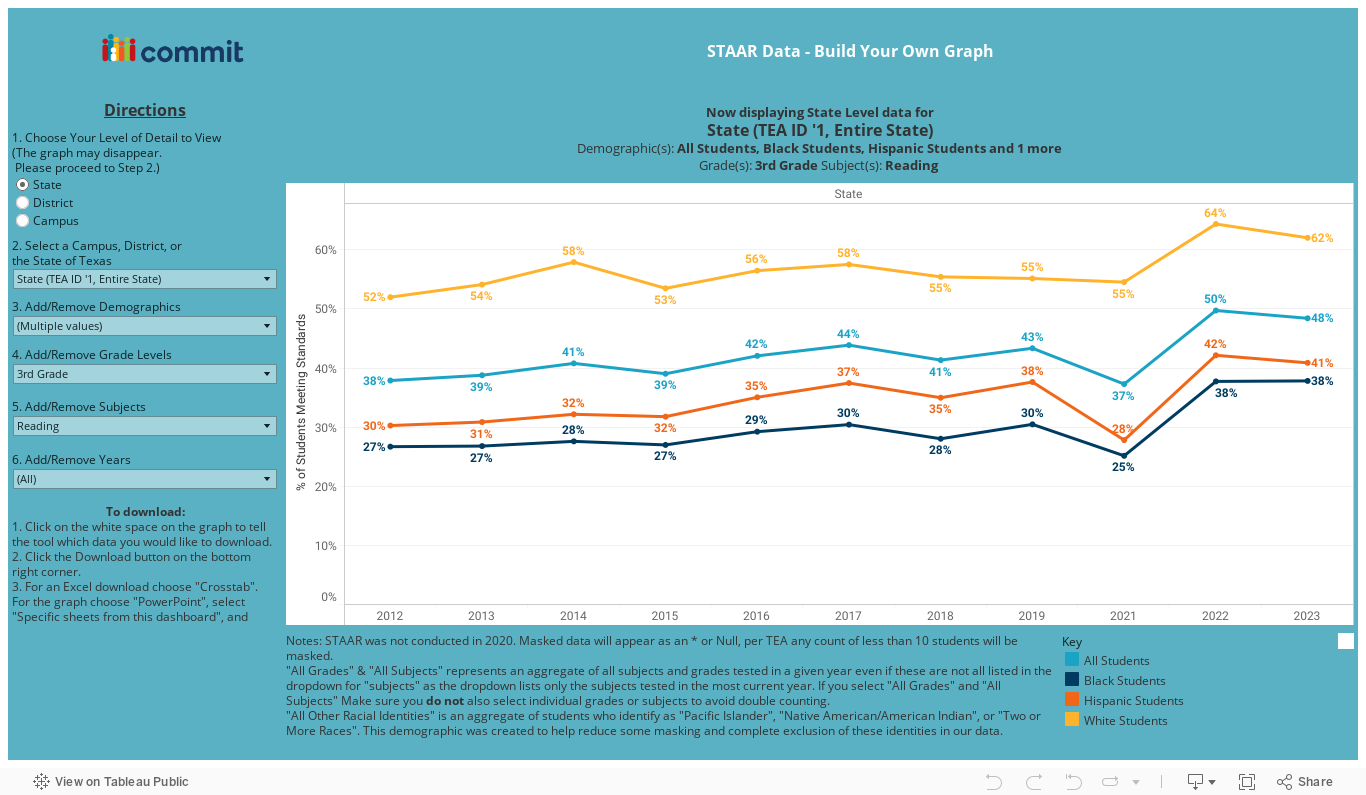
STAAR Data - Build Your Own Graph
- How can I see and compare STAAR data for my child’s school over time?
- How have my district and campus STAAR exam results differed from previous years?
- How do math and reading outcomes differ between demographics at my child's school?
STAAR scores can vary greatly within a county, district, and even between grades in a single school. This dashboard allows for a very granular view of scores, especially disparities between different demographics.

.jpg)
share

Still have data questions?
If you can’t find the data you need, are having trouble, want to offer feedback or find our how our numbers are calculated, we’re here for you.
Be a part of the impact
Invest


.avif)