Higher Education Completion
- How have high school and college graduation rates changed in Texas?
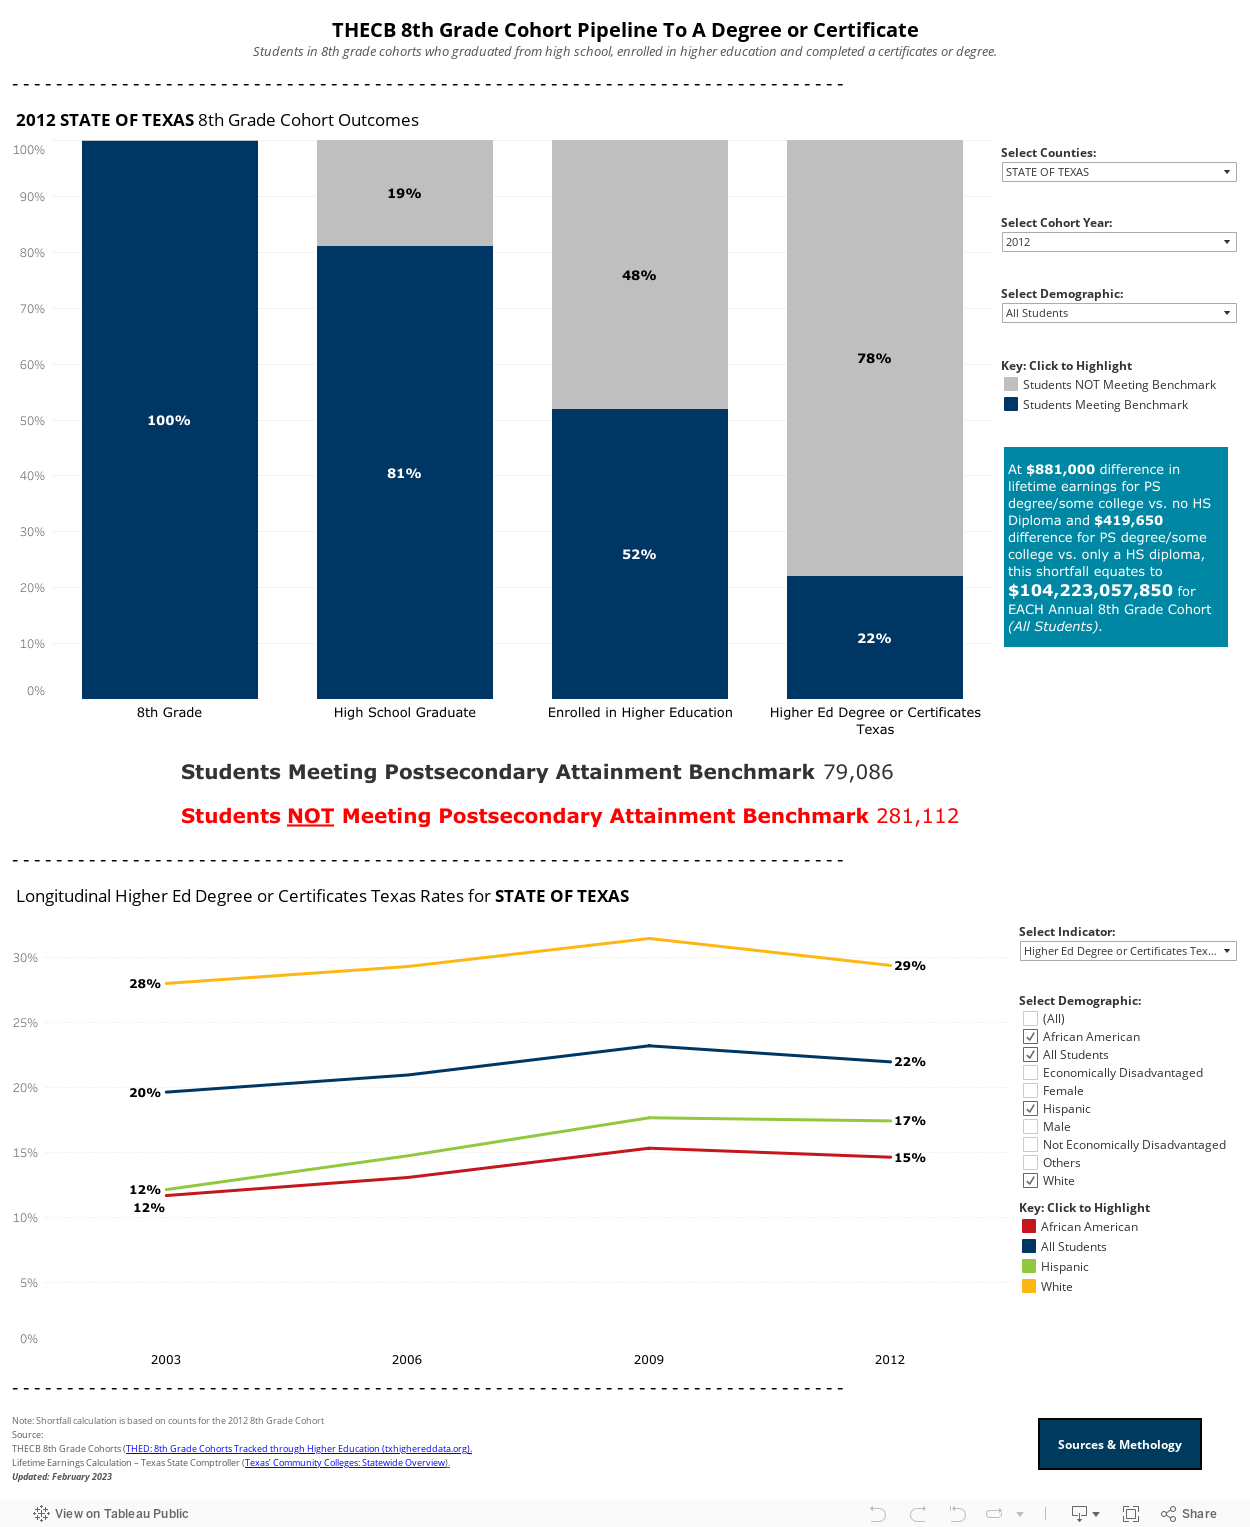
- How many students that finish eighth grade go on to earn postsecondary degrees and certifications?
- How do higher ed completion rates differ by race/ethnicity or socioeconomic status?
This dashboard tracks multiple 8th grade cohorts overtime to see how many go on to earn higher education degrees or certificates. Monitoring overtime allows us to see where students are leaving the pipeline to postsecondary completion.
.jpg)
Higher Education Completion

Heading 1
Heading 2
Heading 3
Heading 4
Heading 5
Heading 6
Lorem ipsum dolor sit amet, consectetur adipiscing elit, sed do eiusmod tempor incididunt ut labore et dolore magna aliqua. Ut enim ad minim veniam, quis nostrud exercitation ullamco laboris nisi ut aliquip ex ea commodo consequat. Duis aute irure dolor in reprehenderit in voluptate velit esse cillum dolore eu fugiat nulla pariatur.
Block quote
Ordered list
- Item 1
- Item 2
- Item 3
Unordered list
- Item A
- Item B
- Item C
Bold text
Emphasis
Superscript
Subscript

Still have data questions?
If you can’t find the data you need, are having trouble, want to offer feedback or find our how our numbers are calculated, we’re here for you.
Be a part of the impact


.avif)