STAAR performance
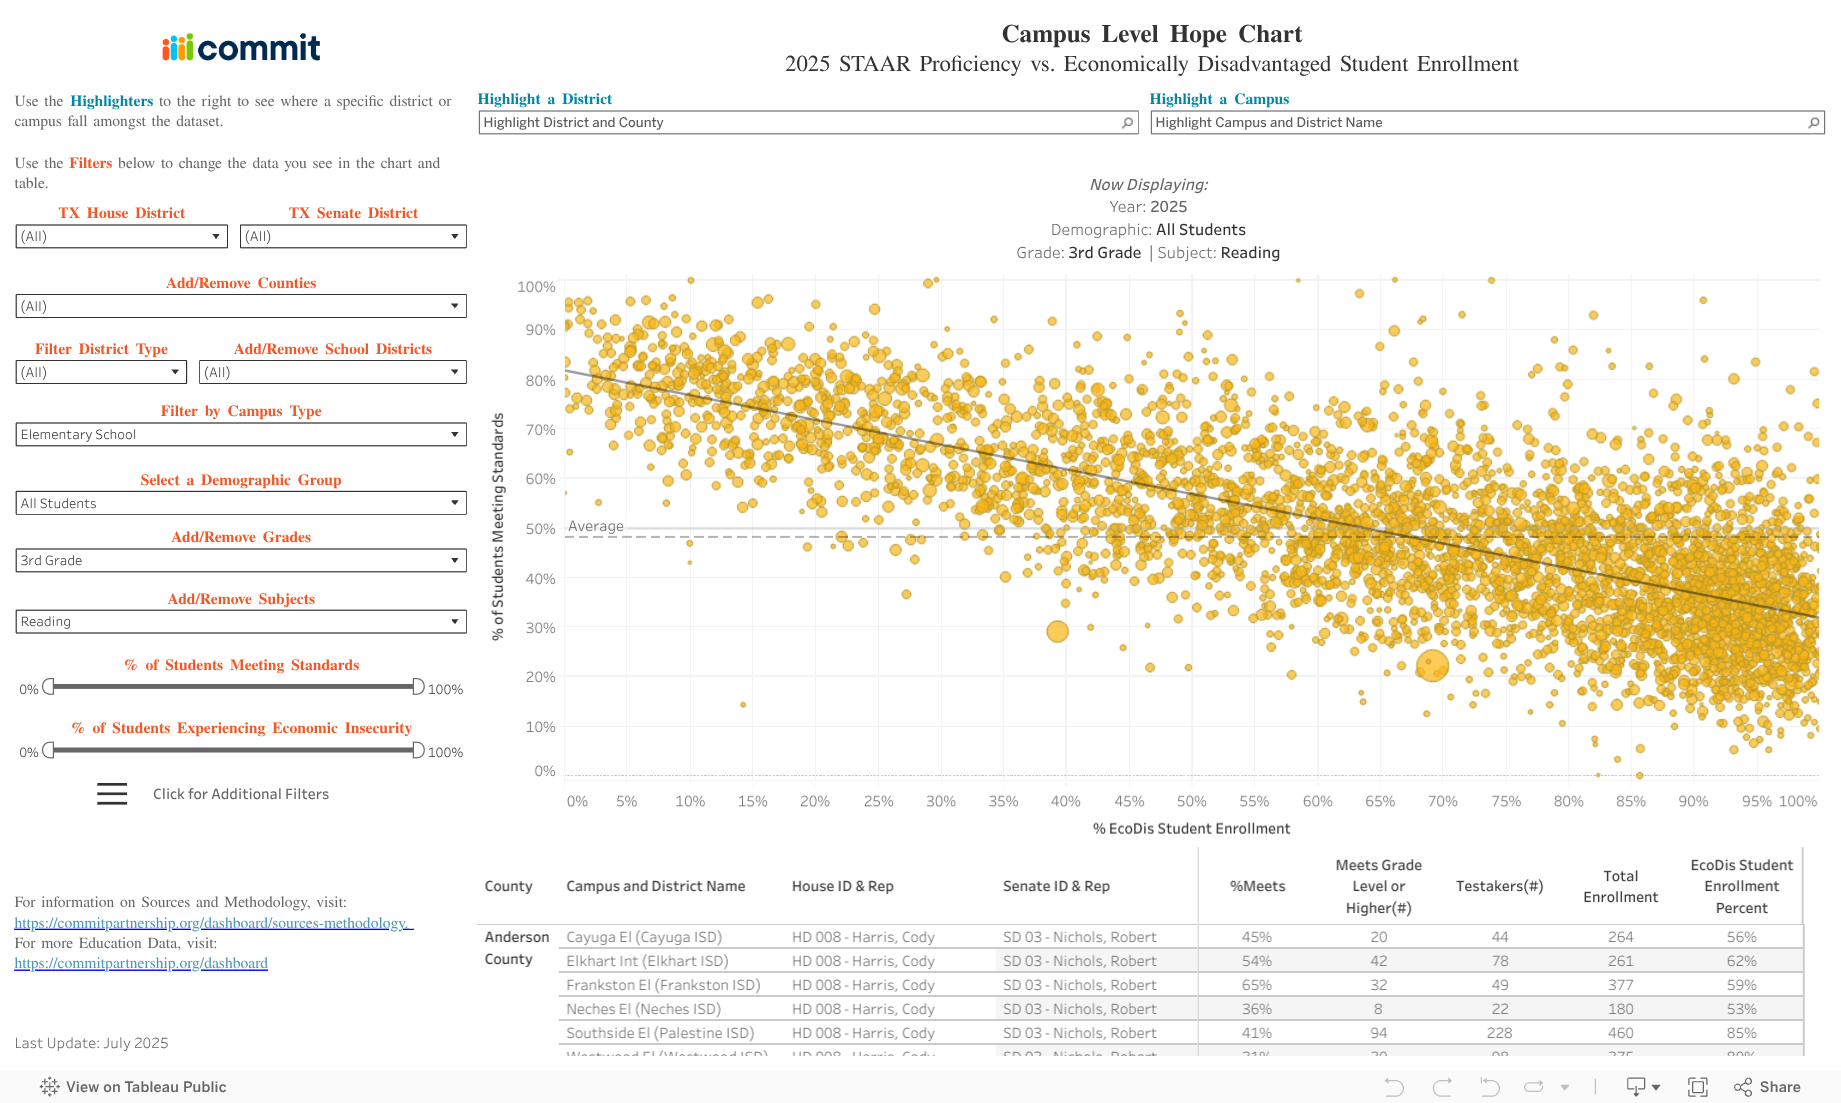
Visualize Campus-Level STAAR Performance Across Texas
- Which schools in my district are exceeding expectations?
- What percentage of economically disadvantaged students in my county are meeting grade-level standards on the STAAR exam?
- Which demographic groups need extra support to meet STAAR standards?
Research shows that experiencing economic disadvantages tends to correlate with lower expected outcomes for students. This scatter plot view helps identify Bright Spots, or campuses exceeding expectations.


share

Still have data questions?
If you can’t find the data you need, are having trouble, want to offer feedback or find our how our numbers are calculated, we’re here for you.
Be a part of the impact
Invest


.avif)